Does America Really Have a Doctor Shortage?
People frequently suggest that America is short of doctors, and if you've tried to make a primary care appointment recently in Boston or San Francisco, you might agree — as the scheduler explains that the first available appointment is two months away.
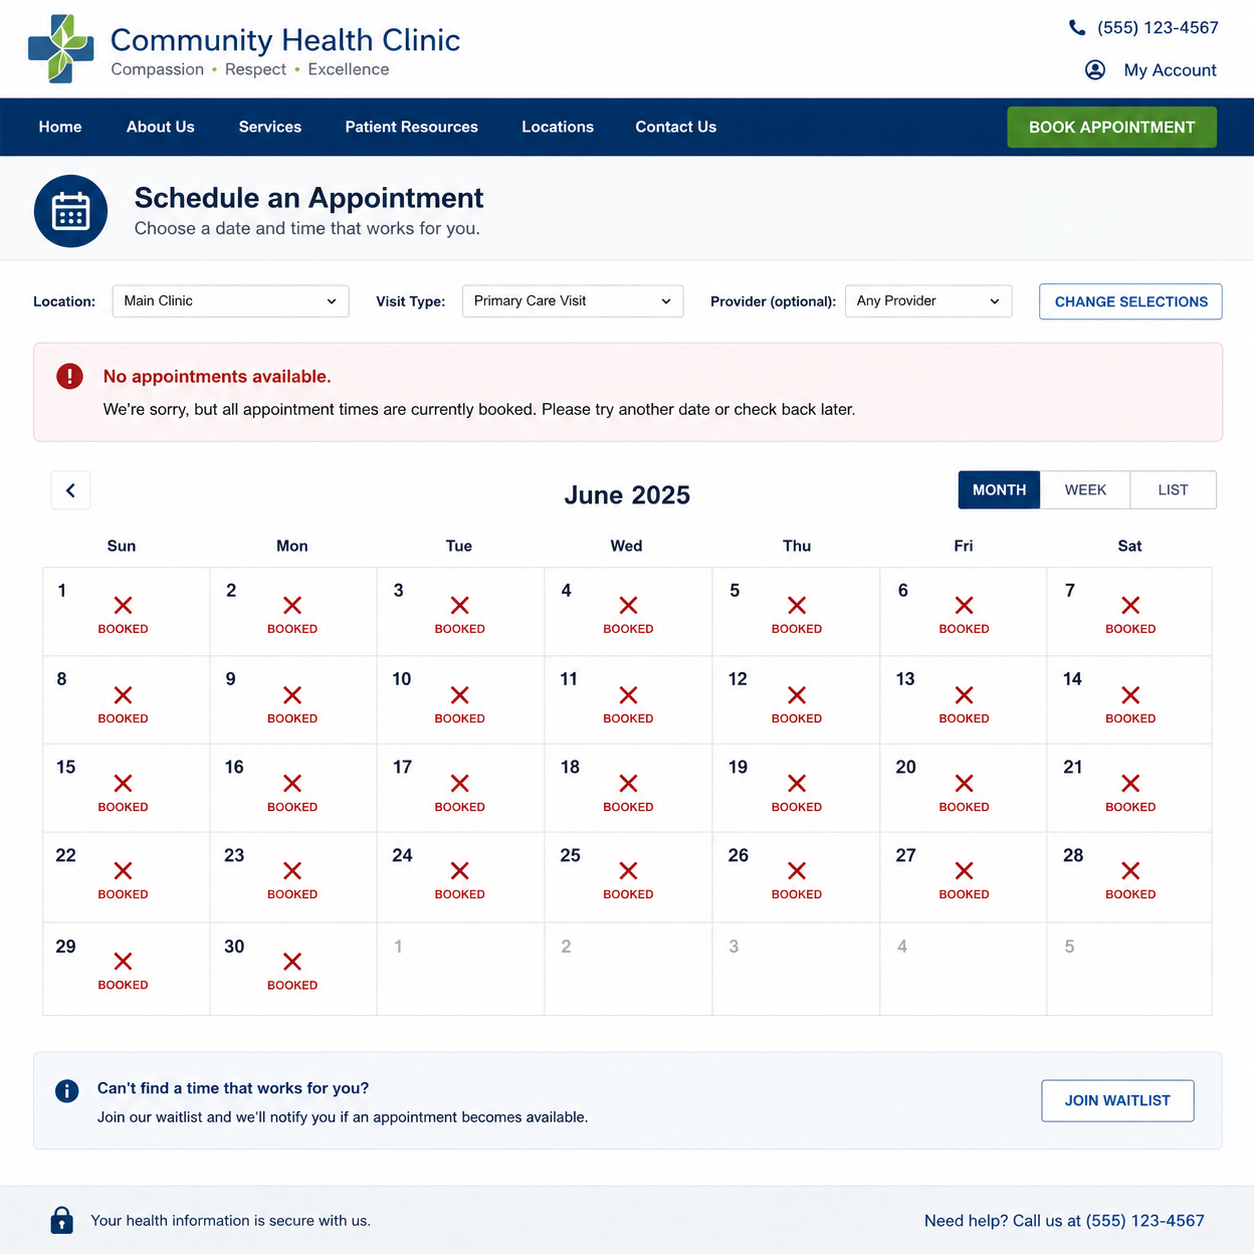
“We have one spot available in 2028.”
The institutions agree too: the AAMC projects a shortfall of up to 86,000 physicians by 2036, HRSA up to 187,000 by 2037.
A response is already moving through Congress: the Resident Physician Shortage Reduction Act would add 14,000 Medicare-funded residency slots over seven years — a multibillion-dollar expansion of physician training, backed by the AAMC, the AMA, and the hospital associations.
But packed clinic schedules in coastal cities might not mean what we think they mean.
The Boston problem
In AMN Healthcare's 2025 survey of physician appointment wait times, Boston had the longest average wait in the country: 65 days for a new patient appointment, against a survey average of 31 days.
Massachusetts also has more physicians per capita than any state in America — 485 per 100,000 against a national average of 304. It leads the states on direct-patient-care physicians too, at 371 per 100,000 against a national 255.
So . . . the place with the most doctors has the longest waits.
AMN then offers this as evidence of a doctor shortage. Which makes zero sense: if more doctors meant shorter waits, Boston would be the easiest place in America to make an appointment.
The pattern holds across all fourteen metros. When you plot each city's wait time against its supply of direct-patient-care physicians, the relationship a shortage would predict — more doctors, shorter waits — isn't there.
[Note: I left Washington, DC, the fifteenth metro AMN surveys, off the graph. DC is a city with no state of its own, and its physicians serve the whole region, not just DC residents. This inflates its per-capita density beyond any other metro.]
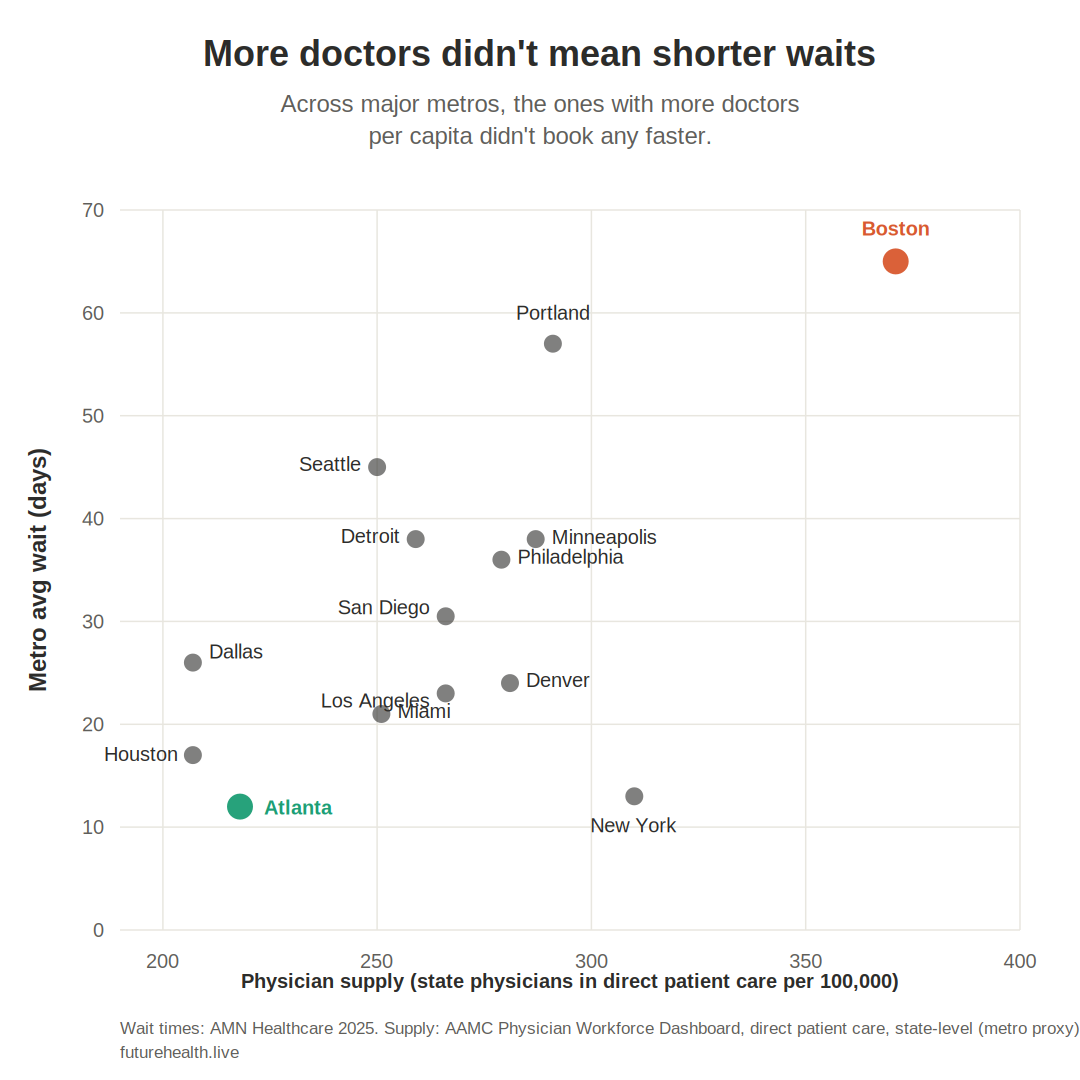
If low supply drove the booking delays, the densest metros would have the shortest waits. Instead the points scatter with no slope — supply explains essentially none of the variation. Whatever is behind these waits, a raw shortage of doctors ain't it.
A wait time is a ratio
How long you have to wait for an appointment reflects a ratio: the number of people seeking appointments, divided by the number of appointment slots on offer.
The numerator — people seeking appointments — depends on population, on how sick that population is, and on something the shortage debate ignores entirely: how many health tasks still require an appointment at all. Every task that moves to a chatbot, a wearable, a home test, or a DTC platform removes appointment-seekers from the numerator without anyone in a clinic noticing.
The denominator — available slots — is more complicated than "number of doctors." How many slots exist depends on several things:
How many clinicians are practicing (physicians, NPs, PAs)
How many hours each one works, and how many of those hours go to bookable visits rather than documentation, inbox messages, and prior authorizations
How many points of access exist, which depends on clinic openings, closings, and consolidation
How long each visit runs, since the same clinician-hours yield fewer slots when each patient takes longer — and as tech absorbs the simple visits, the ones left in the clinic are likely to be more complex
A long wait tells you the ratio is high. It tells you nothing about which term moved. That's the critical error in the doctor-shortage consensus: assuming the numerator (demand) is rising.
Busy clinics don't prove increasing demand
Every single time I mention demand migrating out of the healthcare system to a doctor in practice, they tell me "well, myclinic is packed."
But busy clinics are not proof of high demand. Busy clinics happen whenever demand outpaces capacity, and that can happen whether demand is rising OR falling — because capacity can move, too.
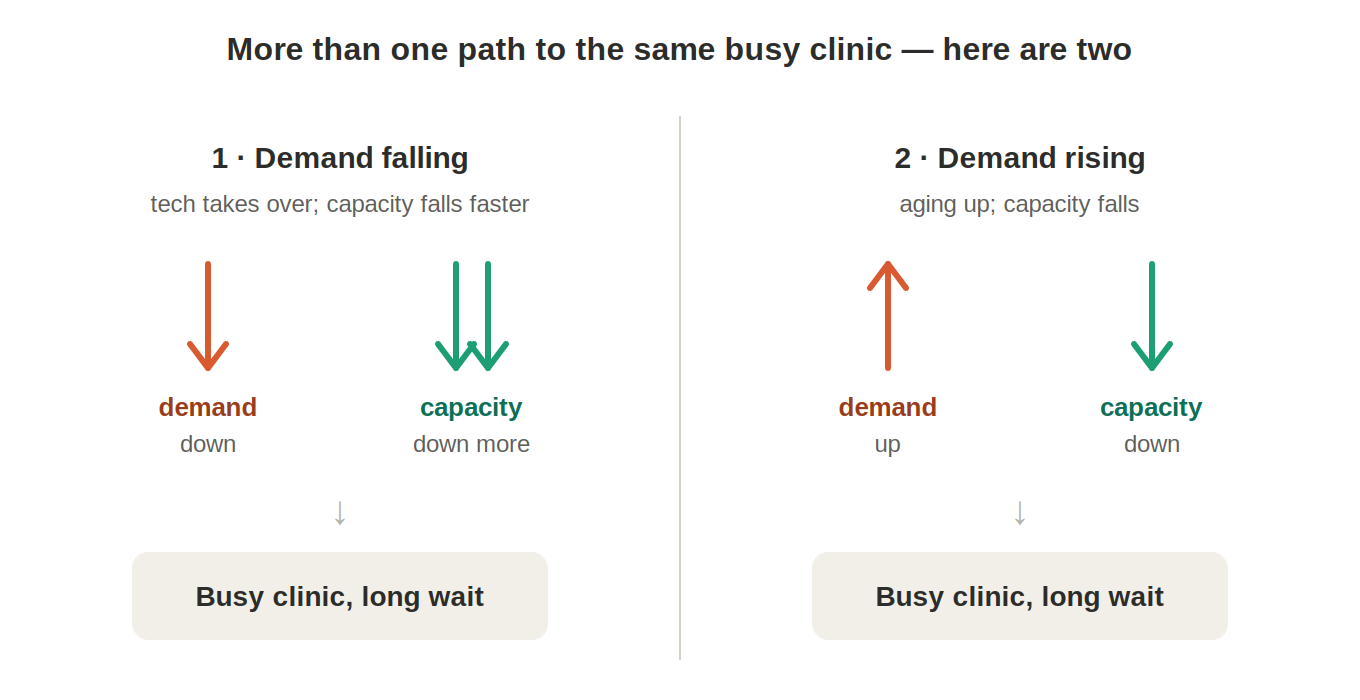
Take two clinics with identical month-long waits. In the first, visit demand is falling — patients are handling more themselves, asking an app the questions they once booked a visit for — but clinical capacity is falling faster: retirements, burnout exits, reduced hours, closures, consolidation. Fewer doctors have to deal with a still-larger pool of patients — a shrinking restaurant district can still have lines out the door.
In the second, visit demand is rising with an aging population, and capacity is falling for the same reasons. Demand up, capacity down.
Both clinics are slammed. Both have a long wait. The waiting rooms look identical. And only the second is the demand-rising story my busy physician colleagues assume — along with the press, and the government, and the trade organizations. The busy clinic is evidence that demand currently exceeds capacity — nothing more. It cannot tell you which one moved, and so it cannot, by itself, support either my claim that demand is leaving OR the common claim that supply is insufficient.
Of course, genuine localized shortages can still exist in certain specialties or underserved areas. The discussion here concerns the national picture.
What the data show
The denominator: slots
Total physician supply is growing, not shrinking. The US had 1,032,365 active physicians in 2024 — 304 per 100,000 people, up from 278 per 100,000 in 2018. America has more doctors than ever — per capita and in absolute numbers.
Primary care supply is roughly flat per capita. The Milbank scorecard puts primary care physicians at about 67 per 100,000, down slightly over the past decade, with total primary care clinicians (including NPs and PAs) at 103.8 per 100,000 in 2022, also down slightly. A modest decline — not a collapse.
The access infrastructure is consolidating fast. Between 2018 and 2026, hospitals and corporate entities acquired 85,000 physician practices; the number of independently owned practices fell by 81,100, and only 18% of physicians now work in physician-owned practices. Acquisition isn't closure — but acquirers typically prune. In 2024 and 2025, corporate entities bought 8,000 more practices while growing the physician headcount inside them by less than 1% — prompting the Physicians Advocacy Institute, which tracks these acquisitions, to ask whether owners were shedding doctors after buying the practice.
The attempts to add capacity are failing. The retail entrants that promised new primary care slots are retreating. Walmart Health shut all 51 of its clinics; Walgreens' VillageMD closed about 160. The for-profit clinic, built to expand access, keeps proving hard to run at a profit. Each closure pours its panel into the remaining clinics' schedules.
But nobody counts the slots. No agency, registry, or dataset tracks the total number of primary care or specialist appointment slots in America over time. We count doctors and we count visits that happened. We do not count the capacity offered, or how much of each physician's time still produces a bookable slot rather than paperwork. So the denominator itself is a guess.
The numerator: appointment-seekers
Demand for traditional visits is falling. Ganguli et al. found primary care visits per capita fell 24% from 2008 to 2016, with roughly three quarters of the decline unexplained by shifts to other clinical settings. The authors speculated that part of the decline could be because of patients using the internet to answer medical questions.
And that was before ChatGPT, before continuous glucose monitors at CVS, before 14 million US adults skipped a provider visit in a single month after getting advice from AI — a finding I covered in April.
In any case, if demand were genuinely surging against fixed supply, per-capita visit rates would be rising. But they're falling (at least in primary care).
And nobody counts where the demand went. We have no measure of how much health need is now met without a provider at all — answered by an AI chatbot, tracked by a wearable, resolved by a home test. A person who manages their condition through an app and never books a visit is invisible to every dataset we have. So we cannot say whether falling visits mean demand is falling vs demand is migrating out of the clinic.
The models assume the answer
The shortage projections can't resolve this, because they assume their own conclusion. Both the AAMC and HRSA models estimate future demand the same way: take current per-capita utilization rates and multiply by demographic projections.
Neither model contains a variable for demand leaving the clinical setting. There is no term for the Knowledge Migration already visible in Ganguli's missing visits, no term for Monitoring Migration to the wrist, no term for Diagnosis Migration to the chatbot — and no term for Demand Elimination via GLP-1 medications shrinking the need for everything from bariatric surgery to diabetes visits to knee replacements.
A model that defines demand as "what people did in 2021, forever" will project a shortage and rising demand in any future where the population ages — including a future where half the appointment book has moved to channels the model can't see.
A recent JAMA paper shows how deep the assumption runs. Four physicians propose financing primary care as a public utility, citing as evidence of failure that more than a third of US adults lack "a usual source of care." But a usual source of care is a measure of utilization, not necessarily a measure of demand. Those without a usual source of care include people who need care and can't get it — and people who are meeting need through an app or a wearable or a Google search. Once again the healthcare system seems incapable of imagining, or measuring, the possibility of demand reduction.
This is the same blind spot I described in the $50B measurement piece: the system measures the healthcare delivered inside its own walls and mistakes that for the whole of how people stay healthy — missing the self-care now happening outside it, where no provider is involved at all.
Diagnosis before cure
Put the findings together — per-capita physician supply rising, primary care supply roughly flat per cap, per-cap visits dropping, clinics consolidating and slots unmeasured — and the pattern is at least as consistent with the demand-falling path as the demand-rising one.
Which returns us to Boston. The city with the most doctors and the longest waits is exactly what you'd expect in a system where academic medical centers have absorbed the practices, the absorbed practices offer fewer slots, the simple visits have migrated out, and the complex ones that remain take 40 minutes each. A 60-day wait can arise from all of this without any shortage of physicians at all.
Does America have a doctor shortage? The data we have show more doctors than ever serving fewer traditional visits than ever through fewer access points than ever. And as I argued last month, the set of tasks that requires a physician is shrinking while we debate how many physicians to train.
So authorities are proposing that we spend billions training more doctors for a system whose patients are leaving — but we haven't yet bothered to quantify either the currently available clinician slots or the extent to which demand is departing.
I suggest we spend a tiny fraction of those dollars measuring both before we commit to a cure that doesn't match the illness.